Learning objectives
|
Introduction
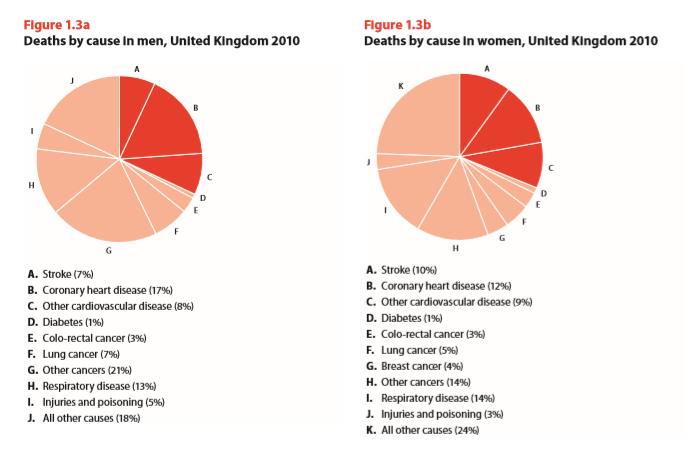
In 2010 stroke caused almost 50,000 deaths in the UK with approximately 32,000 in England [1]. Newer data shows that 57,000 people had their first-time stroke in 2016. More than 140,000 people die each year from stroke in the United States. Death rates from stroke vary across the UK with the highest rates in Scotland, the North of England, Wales and Northern Ireland. The lowest rates are in the South of England, particularly in London. One in five strokes are fatal. The proportion of deaths for males and females can be seen in the chart below.
Stroke mortality rates have halved over the last 20 years and reductions have been seen in the UK and USA. Deaths related to stroke in the UK have declined by 49% in the past 15 years. This has been accredited to a combination of better prevention, earlier treatment and more advanced treatment. However data shows that the age-speci’¼üc mortality from stroke in England and Wales has been declining throughout the twentieth century and predated modern care. Reasons may be due to the fact that we detect and so diagnose milder strokes much better these days with access to imaging.
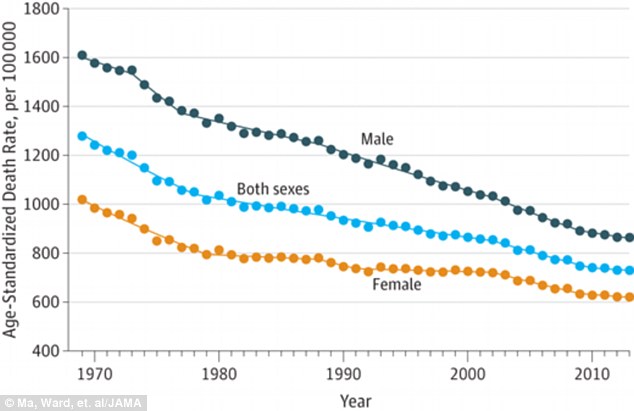
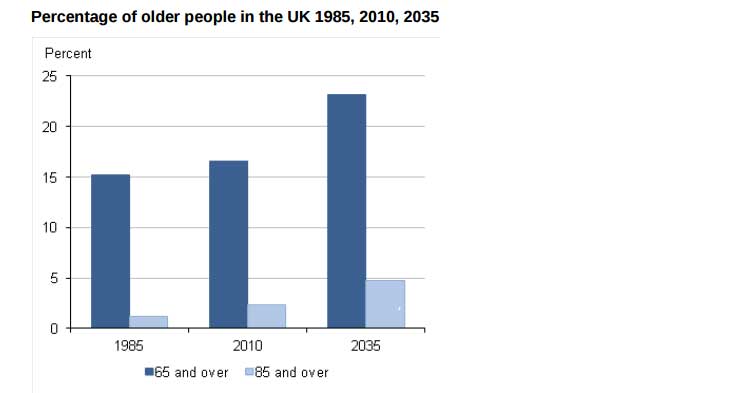
The fall in mortality for stroke does not always mean less patients dying from stroke as the age of the population increases and so the proportion of older patients increases and continues to increase over the next few decades.
Stroke Mortality by Stroke Type
| Stroke type | Mortality at one month (95% CI) | Mortality at one year (95% CI) |
|---|---|---|
| Cerebral infarction | 10% (7ŌĆō13) | 23% (19ŌĆō27) |
| Primary intracerebral haemorrhage | 50% (38ŌĆō62) | 62% (43ŌĆō81) |
| Sub-arachnoid haemorrhage | 46% (29ŌĆō63) | 48% (24ŌĆō72) |
| Uncertain type | 77% (46ŌĆō100) | 84% (52ŌĆō100) |
| All | 19% (16ŌĆō22) | 31% (27ŌĆō35) |
Stroke Mortality by Geography
During 2007ŌĆō2009, the age-adjusted death rate from stroke in the United States among persons aged Ōēź18 years was 54.6 per 100,000 population. Among states, the rate ranged from 36.9 deaths per 100,000 population in New York to 72.5 in Alabama. In general, death rates were higher among states in the South and lower among states in the Northeast census regions [2].
Stroke Mortality by Race
The mortality of stroke is higher in the black population than in the white population in the USA [3]. This has not been confirmed in the UK where it has ben shown that although the black population is at increased risk of stroke and most subtypes of stroke, this is not translated into significant differences in survival [4]. There may be other reasons for this such as a disparity in access to healthcare.
General Risk factors
The list below is not an exhaustive list of all the things that increase stroke mortality. Some are self evident. Frailty, multiple comorbidities, malignancy, others are less so
- African-Caribbean population > White
- Haemorrhagic > Ischaemic
- Age of the patient
- Subarachnoid haemorrhage
- TACS
References
- [1] Townsend N, Wickramasinghe K, Bhatnagar P, Smolina K, Nichols M, Leal J, Luengo-Fernandez R, Rayner M (2012). Coronary heart disease statistics 2012 edition. British Heart Foundation: London. P19
- [2] National Vital Statistics System
- [3] StrokeŌĆöIncidence, Mortality, Morbidity and Risk. J Insur Med 2004;36:143-152
- [4] Wolfe CDA et al. Incidence and case fatality rates of stroke subtypes in a multiethnic population: the South London Stroke Register. Journal of Neurology, Neurosurgery & Psychiatry. 2002, 72 (2): 211-216
| Note: The plan is to keep the website free through donations and advertisers that do not present any conflicts of interest. I am keen to advertise courses and conferences. If you have found the site useful or have any constructive comments please write to me at drokane (at) gmail.com. I keep a list of patrons to whom I am indebted who have contributed. If you would like to advertise a course or conference then please contact me directly for costs and to discuss a sponsored link from this site. |